Adjusting the General Display Settings
Proceed as follows to adjust the general settings:
-
Start transaction /DVD/MON.
-
In the menu bar, click Settings > User settings.
-
Click General.
-
Select the options explained below based on your preferences.
-
Click Save.
The following options are available:
-
Display full system ID: Allows you to display a full system ID in 10 characters.
-
Ping system on refresh: Tests the connection to all monitored systems every time CrystalBridge® Monitoring is refreshed.
NOTE This option can slow down the response of the GUI because all connections are tested.
-
Ping application server on refresh: Tests the connection to all application servers every time CrystalBridge® Monitoring is refreshed.
NOTE This option can slow down the response of the GUI because all connections are tested.
-
Set last time interval on startup: Saves the last specified time interval before closing CrystalBridge® Monitoring and uses it when relaunching CrystalBridge® Monitoring.
-
Don't use user's local time zone: Displays all time fields in CrystalBridge® Monitoring in the time zone of the central system.
-
Hide unused KPI from KPI groups: Hides all inactive KPIs from the KPI groups tree.
-
Hide unused KPI groups: Hides all inactive KPI groups from the KPI groups tree.
-
Hide non-collected detail tables: Hides detail tables that are not collected. You can adjust this setting to display all available detail tables. By default, this setting is selected in order to display only the collected detail tables in the Details tab.
-
Hide non-monitored servers from pool tree: Hides all servers under System landscape that are marked as Don't monitor in the system settings.
-
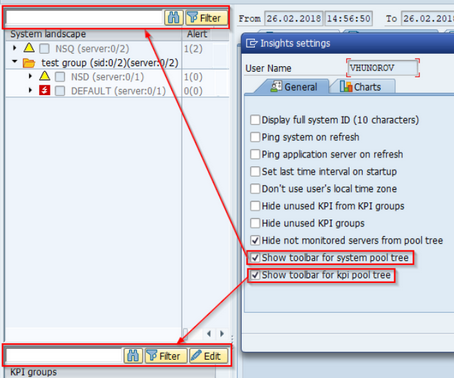
Show toolbar for system pool tree: Allows you to navigate to a folder of the system pool tree by entering its description or name. For example, if you enter the KPI CPU, all the KPIs that include CPU within their name are displayed. By default, the search bar for the system landscape is hidden.
-
Show toolbar for KPI pool tree: Allows you to navigate to a folder of the KPI pool tree by entering its description or name. For example, if you enter the KPI CPU, all the KPIs that include CPU within their name are displayed. By default, the search bar for the system landscape is hidden.